To view the project on GitHub, click here.
Using logistic regression modeling in Python, I built a simulation to predict which NCAA basketball teams would advance from the Sweet 16 to the Elite 8 in the 2025 March Madness tournament.
But this wasn’t just about generating a bracket—it was about exploring how predictive analytics can offer real insight, even in chaotic, high-pressure environments like college basketball.
🧠 What the Model Did
- Merged and cleaned advanced and basic NCAA team stats
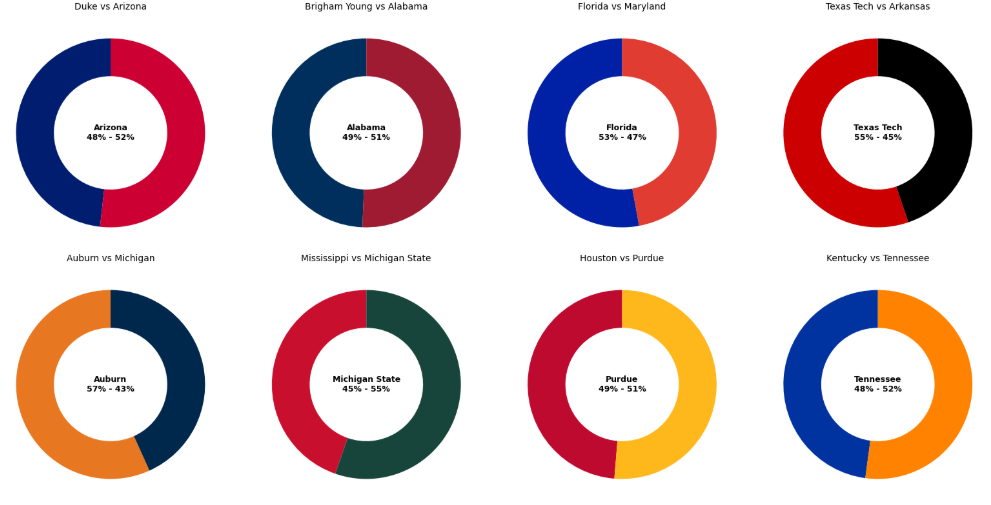
- Used logistic regression to generate win probabilities for each Sweet 16 matchup
- Simulated 10,000 outcomes per matchup to ensure predictive reliability
- Visualized results using a custom donut chart for each game’s predicted outcome
The model used 10 key features like FG%, 3P%, SRS, rebounds, and assists—focusing not just on overall record but on deeper performance metrics. The result? A model that correctly predicted 6 out of 8 Elite 8 teams, with a 75% accuracy rate.
📈 What I Learned
- How to apply machine learning (logistic regression) to real-world prediction tasks
- The value of simulation in handling uncertainty and marginal outcomes
- The limits of using regular-season data to predict tournament performance
- How to communicate results visually and clearly for a mixed audience
This project also reinforced the importance of critically evaluating incorrect predictions—both misses occurred in near-even matchups (51–52% predictions), proving just how nuanced predictive analytics in sports can be.
🛠️ Key Skills Used
- Python: pandas, sklearn, matplotlib, numpy
- Modeling: Logistic regression, feature normalization, simulation
- Data Visualization: Custom matplotlib donut chart for matchups
- Critical Evaluation: Accuracy analysis, feature importance interpretation
👋 Let’s Connect
If you’re hiring for a data analyst or machine learning role—or just appreciate a well-modeled bracket—I’d love to chat. Feel free to reach out, connect on LinkedIn, or explore more projects on my site.